

5G NR Numerology Selection

Introduction
Unlike 4G LTE, which relied on a fixed Subcarrier Spacing (SCS) and a static subframe duration, 5G New Radio (NR) introduces a flexible OFDM numerology frame structure scaling as Δf=15×2^μ kHz.
Selecting the optimal numerology parameter (μ∈{0,1,2,3,4}) governs a direct trade-off between coverage geometry, PHY-layer latency, Doppler resilience, and hardware processing overhead.

1. Fundamentals of 5G Flexible Numerology
3GPP TS 38.211 specifies the mathematical foundation for scalable subcarrier spacing:
Δf=15×2^μ kHz, where μ is the numerology configuration index.
Physical Layer Scaling Relations
Tsymbol=1/Δf=(66.67 μs)/2^μ
TCP ≈(4.69 μs)/2^μ     (Normal CP)
Nslots, subframe & μ =2^μ  where 1subframe=1 ms
Tslot= (1 ms)/2^μ = 14 OFDM symbols /2^μ
μ | SCS (kHz) | Slot duration | Normal CP (µs) | Max cell radius | Primary domain |
0 | 15 | 1.00 ms | ~4.69 µs | ~1.40 km | Sub-3 GHz FDD |
1 | 30 | 0.50 ms | ~2.34 µs | ~0.70 km | 2.3–4.9 GHz TDD |
2 | 60 | 0.25 ms | ~1.17 µs | ~0.35 km | FR1/FR2 bridge |
3 | 120 | 0.125 ms | ~0.59 µs | ~0.17 km | FR2 mmWave |
4 | 240 | 0.0625 ms | ~0.29 µs | ~0.08 km | FR2 SSB search |
2. RF Trade-offs: Coverage vs. Latency vs. Mobility
A. Cell-Edge Coverage (The +3 dB Thermal Noise Penalty)
Thermal noise power per Resource Block (RB) is calculated as:
NRB =k⋅T⋅BRB * NF
Where:
	k=1.38×10^(-23) J/K (Boltzmann's constant)
	T=290K (N0=-174dBm/Hz)
	BRB =12×Δf (12 subcarriers per RB)
	"NF"=Receiver Noise Figure (typically 5 dB for UE Uplink)
Noise Floor per RB Comparison
SCS | RB bandwidth | Noise floor | Delta vs 15 kHz |
15 kHz | 180 kHz | −121.45 dBm | — |
30 kHz | 360 kHz | −118.44 dBm | +3.01 dB |
· 15 kHz SCS ( RB BW):
NRB,15 =-174+10log10(180,000)=-121.45dBm 30 kHz SCS ( RB BW):
NRB,30=-174+10log10(360,000)=-118.44dBmIt degrades the Uplink SINR by 3dB, directly shrinking the link budget margin and limiting maximum uplink distance.
Impact on Coverage: Moving a power-limited UE (transmitting at ) from to SCS increases the thermal noise floor per RB by . This degrades the Uplink SINR by , directly shrinking the link budget margin and limiting maximum uplink distance.
B. Multipath Delay Spread & Inter-Symbol Interference (ISI)
The Cyclic Prefix (CP) acts as a buffer against delay spread caused by signal reflections:
Maximum Un-aliased Path Difference (Δd)=c×TCP
15 kHz SCS (Tcp=4.69us):
Δd=(3×10^8m/s)×(4.69×10^(-6)s)=1.407km
30 kHz SCS (Tcp=2.34us):
Δd=(3×10^8 m/s×(2.34×10^(-6)s)=0.702km
MULTIPATH PROPAGATION & CP FIT

- If Delay Spread <= CP Duration --> Zero ISI (Orthogonality Maintained)
- If Delay Spread > CP Duration --> ISI Degradation & EVM Floor Spikes
When multipath delay spread exceeds Tcp , adjacent symbols spill into each other, inducing Inter-Symbol Interference (ISI) and creating an Error Vector Magnitude (EVM) floor that severely degrades the modulation scheme (e.g., dropping 64QAM down to QPSK).
C. Phase Noise and High Doppler Tracking
At higher RF carrier frequencies (fc), local oscillator phase noise density increases significantly, causing Inter-Carrier Interference (ICI).
PHASE NOISE & SUBCARRIER SPACING

The maximum tolerable Doppler shift without severe ICI is roughly a fraction of the SCS:
f(D,max)=(v/c)*fc ≤ η⋅Δf (where η≈0.05 to 0.10)
For a train moving at v=300km/h (83.33m/s) on a 3.5Ghz carrier:
fD=[83.33/(3×10^8)]×(3.5×10^9)≈972.2Hz
15 kHz SCS: Frequency offset ratio 972.2/15000 = 6.48% (High ICI Risk)
30 kHz SCS: Frequency offset ratio 972.2/30000= 3.24% (Safe Margin)
3. Real-World Operator Case Studies
GLOBAL OPERATOR NUMEROLOGY PROFILE
Operator | Band | Numerology | Use Case |
AT&T / Dish | n71/n70 (low-band FDD) | u=0 (15 kHz) | Max coverage |
Reliance Jio | n28 (700 MHz FDD) | u=0 (15 kHz) | Rural coverage |
Jio / Airtel | n77/n78 (3.5 GHz TDD) | u=1 (30 kHz) | High capacity |
Rakuten Mobile | n257 (28 GHz mmWave) | u=3 (120 kHz) | Ultra-low latency |
Case 1: Reliance Jio (India)
Tier | Band | Duplex / Bandwidth | SCS | Role |
Tier 1 | n28 (700 MHz) | FDD, 10 MHz | 15 kHz | Coverage anchor |
Tier 2 | n78 (3.5 GHz) | TDD, 100 MHz | 30 kHz | Capacity layer |
Tier 3 | n257 (28 GHz) | TDD, 800 MHz | 120 kHz | FWA / hotspot density |
Low-Band Layer: n28 (10Mhz FDD)
SCS: 15Khz(u=0)
RBs Allocated: 52 RBs
Engineering Rationale: Maximizes rural link margin and indoor penetration. 15Khz SCS minimizes thermal noise floor per RB (-121.45dBm) and provides a 4.69us CP duration to absorb long delay spreads in open terrain.
Mid-Band Layer: n78 ( 100Mhz TDD)
SCS: 30Khz (u=1)
RBs Allocated: 273 RBs
Engineering Rationale: Balances baseband FFT processing complexity (Nfft=2048) with lower transmission latency (0.5ms slot) and high phase noise tolerance on 3.5Ghz active antenna units (AAUs).
mmWave Layer: n257 (800Mhz TDD via 8x100 MHz CA)
SCS: 120khz (u=3)
RBs Allocated: 66 RBs per 100Mhz component carrier
Engineering Rationale: Deployed for Fixed Wireless Access (FWA). A 0.125ms slot time yields low air-interface latency, while 120khz subcarriers resist the heavy phase noise inherent to 28Ghz local oscillators.
Case 2: AT&T & Dish/Boost Spectrum (USA)
AT&T Low-Band: n70/n71 / n5 ( 10Mhz - 20Mhz FDD)
SCS:15khz (u=0)
Engineering Rationale: Designed to maximize cell radius in rural highway coverage corridors.
Dish Network Greenfield: n70 ( 25Mhz FDD Block)
SCS: 15Khz (u=0)
Carrier Layout: Split into distinct 5G carriers (10Mhz + 15Mhz) using 15Khz SCS to align with Cloud-RAN processing constraints and maintain link budget balance.
AT&T C-Band: n77 (80Mhz -120MhzTDD)
SCS: 30Khz(u=1)
RBs Allocated: 217 RBs (80Mhz) or 273 RBs (100Mhz)
Engineering Rationale: Uses Massive MIMO (64T64R) beamforming gain to offset the +3.01dB noise floor penalty of 30khz SCS, restoring the link budget match with underlying 15Khz LTE/5G low-bands.
Case 3: Bharti Airtel & Vodafone Idea (India)
Layer | Band | Bandwidth | SCS | Role |
Mid-band | n78 (3.5 GHz) | 100 MHz | 30 kHz | High capacity |
Refarmed low/mid-band | n3 (1800 MHz) / n1 (2100 MHz) | — | 15 kHz | Coverage continuity |
n78 ( 100Mhz TDD): Configured with 30khz SCS (273 RBs).
Refarmed FDD Bands (n1, n3, n8): Dynamic Spectrum Sharing (DSS) or pure NR using 15Khz SCS to maintain inter-operability and matching frame boundaries with existing 4G LTE deployments.
Case 4: Rakuten Mobile & Deutsche Telekom (Japan & Europe)
Rakuten Mobile (Japan)
n77 (100Mhz TDD at 3.8Ghz ): Configured with 30Khz SCS (273 RBs). Operated entirely within an open RAN (O-RAN) Cloud-DU environment. The 30Khz SCS option reduces lower PHY layer task processing rates from 1000 subframes/sec to 2000 slots/sec, which fits x86 server hardware pipelines efficiently.
n257 ( 400Mhz mmWave): Configured with 120Khz SCS.
Deutsche Telekom (Germany)
n1 ( 20Mhz FDD DSS): Uses 15Khz SCS to share the physical layer grid directly with LTE Band 1.
n78 (90Mhz TDD): Uses 30Khz SCS (245 RBs) to optimize throughput across suburban and dense urban topologies.
4. Comprehensive Mathematical Derivations & Calculations
Peak PHY Data Rate Equation (3GPP TS 38.306)

Where:
J: Number of aggregated component carriers
vlayers: MIMO layers ( 4 for DL, 2 for UL)
Qm: Modulation order (6 for 64QAM, 8 for 256QAM )
f: Scaling factor (1)
Rmax=948/1024=0.92578 (Code rate)
Nprb: Allocated Resource Blocks
Ts,u = 10^-3/14.2^u= (OFDM symbol duration)
OH: Overhead scaling factor (0.14 for Sub-6 GHz DL, 0.18 for mmWave DL)
Scenario Calculations: 20Mhz Bandwidth at 15Khz vs 30Khz SCS
20 MHz BANDWIDTH ALLOCATION MATRIX
SCS | RB count | Used bandwidth | Guard band | Spectral efficiency |
15 kHz | 106 RBs | 19.08 MHz | 920 kHz | 95.4% |
30 kHz | 51 RBs | 18.36 MHz | 1.64 MHz | 91.8% |
Transmission Bandwidth Configuration (3GPP TS 38.101-1)
For 20Mhz Channel Bandwidth:
15kHz SCS (μ=0): NRB =106 RBs ⟹Used BW=106×180kHz=19.08MHz
30 kHz SCS (μ=1): NRB =51 RBs ⟹Used BW=51×360kHz=18.36MHz
1. Peak Downlink Throughput Calculation (Single Carrier)
Parameters: 4 Layer MIMO (v=4), 256QAM (Qm=8), Overhead OH=0.14.
Option A: 20MHz Bandwidth with 15kHz SCS
Ts,0=10^(-3)/(14⋅2^0)=71.428 μs REs per second=(106×12)/(71.428×10^(-6) )=17,808,000RE/s Peak Rate_15=10^(-6)⋅(4×8×1.0×0.92578×17,808,000×(1-0.14))=453.33Mbps
Option B: 20Mhz Bandwidth with 30Khz SCS
Ts,1=10^(-3)/(14⋅2^1 )=35.714 μs REs per second=(51×12)/(35.714×10^(-6) )=17,136,000 RE/s Peak Rate_30=10^(-6)⋅(4×8×1.0×0.92578×17,136,000×(1-0.14))=436.22Mbps
Analysis: In a narrow 20MHz channel, 30kHz SCS reduces peak throughput by ≈3.78%. This reduction happens because wider subcarrier channels leave larger spectral guard bands at the channel edges, reducing available active RBs (51 RBs vs. 106 RBs).
2. Link Budget & SINR Mapping at Cell Edge
System Assumptions:
Max UE Uplink Tx Power (Ptx) = +23dBm
Path Loss (PL) = 130dB
Base Station Receiver NF = 5dB
Prx =23dBm-130dB=-107dBm
SINR Results:
15kHz SCS:
Noise_15=-121.45+5=-116.45dBm
SINR _15=-107-(-116.45)=+9.45dB
30kHz SCS:
Noise_30=-118.44+5=-113.44dBm
SINR_30=-107-(-113.44)=+6.44dB
3. BLER & HARQ Throughput Penalty
LINK BUDGET CORRIDOR AT CELL EDGE

This traces the full link budget from transmitter to outcome at cell edge: +23 dBm Tx power minus 130 dB path loss lands you at −107 dBm received signal — that number is fixed regardless of numerology, since it's purely a function of RF propagation.
What changes is which noise floor you're measuring against — pulling directly from the +3.01 dB penalty shown earlier: the 30 kHz noise floor sits 3 dB higher than 15 kHz (−113.44 vs −116.45 dBm), simply because wider subcarriers capture more thermal noise per RB.
That 3 dB gap in noise floor becomes a 3 dB gap in SINR (+9.45 dB vs +6.44 dB), and at the cell edge that's the difference between a clean link and one that dips into the SINR region where BLER climbs and HARQ retransmissions kick in. It's a concrete illustration of the coverage-vs-capacity trade-off: 30 kHz SCS's noise penalty isn't just an abstract number — at the edge of a cell it can directly cost you link reliability, which is why operators tend to keep low-band/edge coverage on 15 kHz and push 30 kHz+ to mid-band capacity layers, as shown in the tiered deployment tables above.
In a Rayleigh fading channel, the Block Error Rate (BLER) maps to the calculated SINR via an AWGN curve approximation:

SINR vs. BLER CURVES
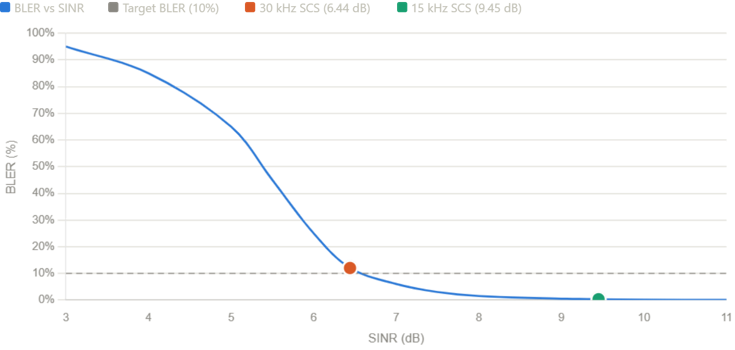
At +9.45dB (15Khz SCS): The UE supports Modulation and Coding Scheme (MCS) 9 (16QAM, Coding Rate 0.43).
Initial BLER≈1.2%⟹Effective Throughput ≈PHY Rate×(1-BLER)=98.8%
At +6.44dB (30Khz SCS): The UE drops down to MCS 5 (QPSK, Coding Rate 0.37) to maintain link stability.
If forced to use MCS 9, the BLER spikes to 38.5%(approx).
Effective Throughput=PHY Rate×(1-0.385)=61.5%
The +3.01dB higher noise floor forces the network to drop to a lower MCS or suffer HARQ retransmissions, drastically reducing effective cell-edge throughput.
5. Network Optimization & Mitigation Strategies
When an operator deploys 30Khz SCS on Mid-band (n77/n78) or 120Khz on mmWave, coverage degradation can be mitigated using specific radio feature configurations.
# | Technique | Mechanism | Effect |
1 | Supplementary uplink (SUL) | n78 for downlink, n28 for uplink | Recovers uplink coverage lost to mid-band path loss |
2 | Uplink Tx switching | 1T2R → 2T2R uplink | Adds transmit diversity/power to extend uplink reach |
3 | Massive MIMO beamforming | 64T64R array, ~+18 dB gain | Focuses energy toward the UE, extending both DL and UL range |
4 | Adaptive frame structure | DSUUU slot layout | Rebalances slot allocation toward uplink-heavy traffic |
Strategy 1: Supplementary Uplink (SUL) & Coverage Enhancement
SUL pairs a high-band TDD downlink (e.g., n78 at 3.5Ghz with 30Khz SCS) with a sub-1 GHz FDD uplink carrier (e.g., n83 or n28 at 700Mhz with 15Khz SCS).
SUPPLEMENTARY UPLINK (SUL) PATHS
Direction | Band | SCS | Duplex | Function |
Downlink | 3.5 GHz (n78) | 30 kHz | TDD | High-rate DL data |
Uplink (SUL) | 700 MHz (n28) | 15 kHz | FDD | Stable, extended-range UL |
Technical Operation:
Downlink: Transmitted on n78 (3.5Ghz) using 30Khz SCS to deliver wideband capacity (100Mhz).
Uplink Switching: When the UE moves to the cell edge and its uplink path loss exceeds a configured threshold (RSRP <-108dBm), the gNB triggers a physical layer Uplink Switch to the SUL carrier (n28, 15Khz SCS).
Gain Realization: Combining lower path loss at 700Mhz (~14dB lower than 3.5Ghz ) with the lower noise floor of 15Khz SCS ( 3dB lower) yields an overall Uplink Link Budget Gain of ~17dB .
Strategy 2: Dual Tx Uplink (2T4R / 2T2R Power Boosting)
Standard UEs operate in 1T4R mode (1 Tx antenna, 4 Rx antennas) limited to +23dBm (200mW) RF power output.
1T4R Configuration: Tx Power = +23 dBm (200 mW)
2T4R Dual Tx Mode : Tx Power = +23 dBm + +23 dBm = +26 dBm (400 mW)
-------------------------------------------------------------------
Net Uplink Coverage Gain = +3.0 dB (Directly Cancels 30 kHz SCS Penalty)
By enabling 2T4R Uplink Transmit Diversity or dual-layer PUSCH transmission (supported in 3GPP Rel-16):
The UE transmits via two independent Power Amplifiers (PAs) simultaneously.
Total transmit power increases to +26dBm (400mW).
This additional +3.0dB power boost cancels out the +3.01dB thermal noise floor penalty caused by 30Khz SCS.
Strategy 3: Massive MIMO Beamforming Gain Matching
To compensate for coverage loss when using 30Khz SCS on mid-band spectrum, base stations deploy 64T64R Active Antenna Units (AAUs).
Beamforming Array Gain=10 log10(Nelements)
Standard Macro Antenna (4T4R): Array Gain ~6dBi
Massive MIMO AAU (64T64R with 192 elements): Array Gain ~18dBi
Net Coverage Advantage=+18 dBi - 6dBi =+12 dB Gain
This +12dB beamforming gain offsets both the 3.5Ghz path loss penalty and the 30Khz SCS noise floor penalty, creating an aligned cell footprint with existing 15Khz low-band sites.
Strategy 4: Dynamic Slot Format & PUSCH Repetition Tuning
For coverage-constrained cells using 30Khz SCS, operators can optimize radio resource allocations through specific scheduling parameters:
PUSCH Repetitions (3GPP Type A/B Repetition):
Configures the gNB to schedule PUSCH transmissions redundantly across 2, 4, or 8 consecutive slots.
Gain: Synthesizes slot aggregation at the physical layer, providing an effective energy-per-bit boost (Eb/N0 gain of 10log10(N) ~3dB to 6dB ) that offsets short 30Khz slot durations.
Configuring Extended Cyclic Prefix (ECP):
Applied in heavy multipath environments (e.g., steep valleys, high-rise urban canyons).
Increases 60Khz SCS CP duration from 1.17us to 4.16us, eliminating multipath-induced ISI floors at the expense of one less symbol per slot (12 symbols vs 14 symbols).
6. Summary Matrix: RF Decision Framework
Use the following framework to select numerology based on carrier frequency, bandwidth, and operational requirements:
Frequency band | Bands | Channel BW | SCS | Deployment domain | Key RF mitigations |
Sub-1 GHz | n5, n8, n28, n71 | 5–20 MHz | 15 kHz (μ=0) | Rural / coverage anchor | None — native max coverage |
1.7–2.6 GHz | n1, n3, n7, n41 | 10–40 MHz | 15 kHz (μ=0) | FDD capacity / urban macro | Dynamic Spectrum Sharing (DSS), LTE rate matching |
3.3–4.9 GHz | n77, n78, n79 | 40–100 MHz | 30 kHz (μ=1) | Mid-band TDD / urban capacity | 64T64R massive MIMO, SUL (sub-1 GHz UL), UE 2T4R |
24–40 GHz | n257, n258, n260 | 100–400 MHz | 120 kHz (μ=3) | mmWave / FWA / dense hotspot | Narrow analog beamforming, short site spacing (<200 m) |
Key Engineering Rules:
Never select 30Khz SCS for sub-2 GHz FDD carriers under 20Mhz bandwidth unless ultra-low air-interface latency (0.5ms) is strictly required, as guard-band overhead and the +3dB thermal noise penalty reduce overall cell performance.
Always deploy 30Khz SCS for C-band (n77/n78) deployments over 40Mhz bandwidth. The 30Khz subcarrier spacing provides essential phase noise resilience and keeps baseband FFT sizes manageable (2048-point). Use Massive MIMO beamforming and Dual-Tx (2T4R) to recover the 3dB uplink noise floor difference.
Deploy 120Khz SCS for FR2 mmWave bands to resist local oscillator phase noise and maintain low latency (0.125ms slots). Compensate for high path loss using narrow high-gain beamforming antenna arrays.
References
1. 3GPP TS 38.211 – NR; Physical channels and modulation
2. 3GPP TS 38.101-1 – NR; User Equipment (UE) radio transmission and reception; Part 1: Range 1 Standalone (Sub-7 GHz)
3. 3GPP TS 38.104 – NR; Base Station (BS) radio transmission and reception
4. 3GPP TS 38.214 – NR; Physical layer procedures for data
5. GSMA – 5G Spectrum Guide & Mid-Band Deployment Recommendations, https://www.gsma.com/spectrum/5g-spectrum-guide/
6. 5G NR Flexible Frame Structure & Numerology Design, https://www.qualcomm.com/research/5g
7. Ericsson Technology Review – 5G NR Physical Layer & Coverage Enhancement Techniques, https://www.ericsson.com/en/reports-and-papers/ericsson-technology-review


Comments